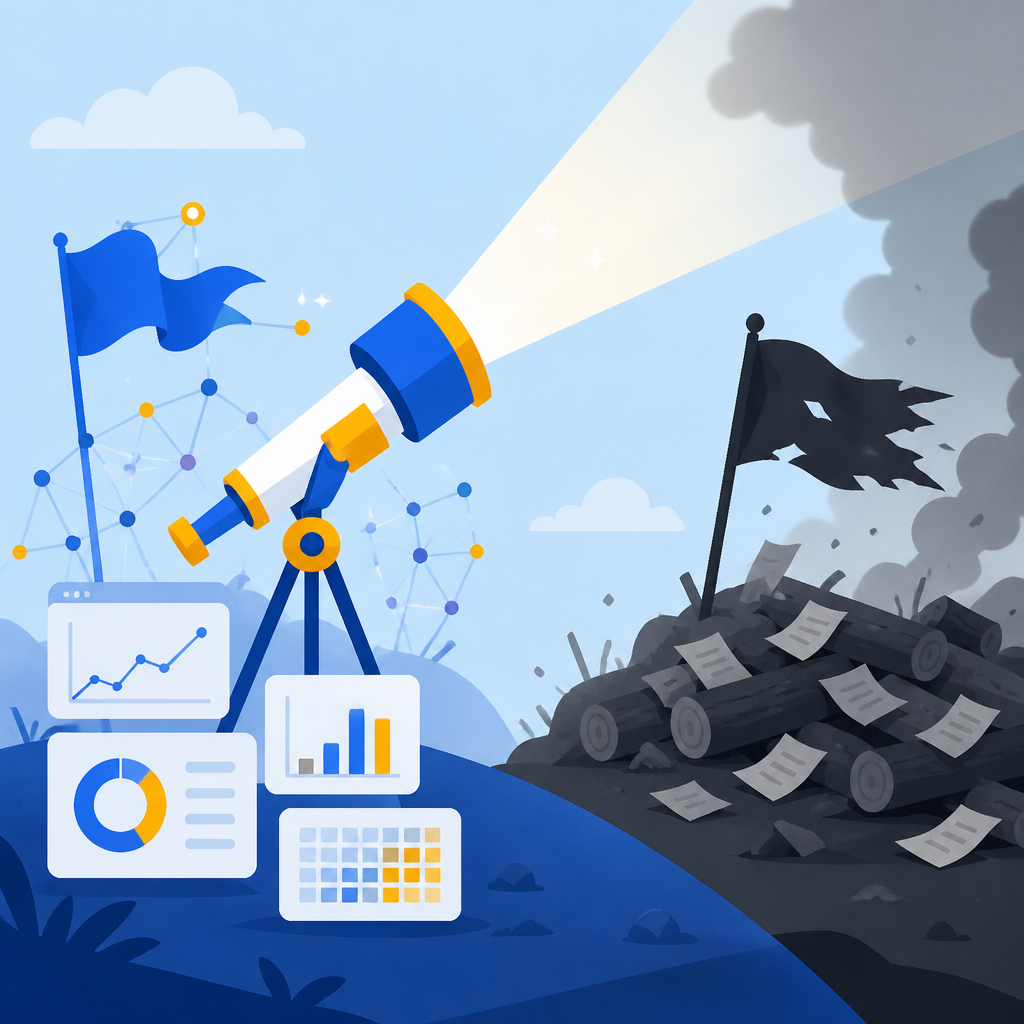
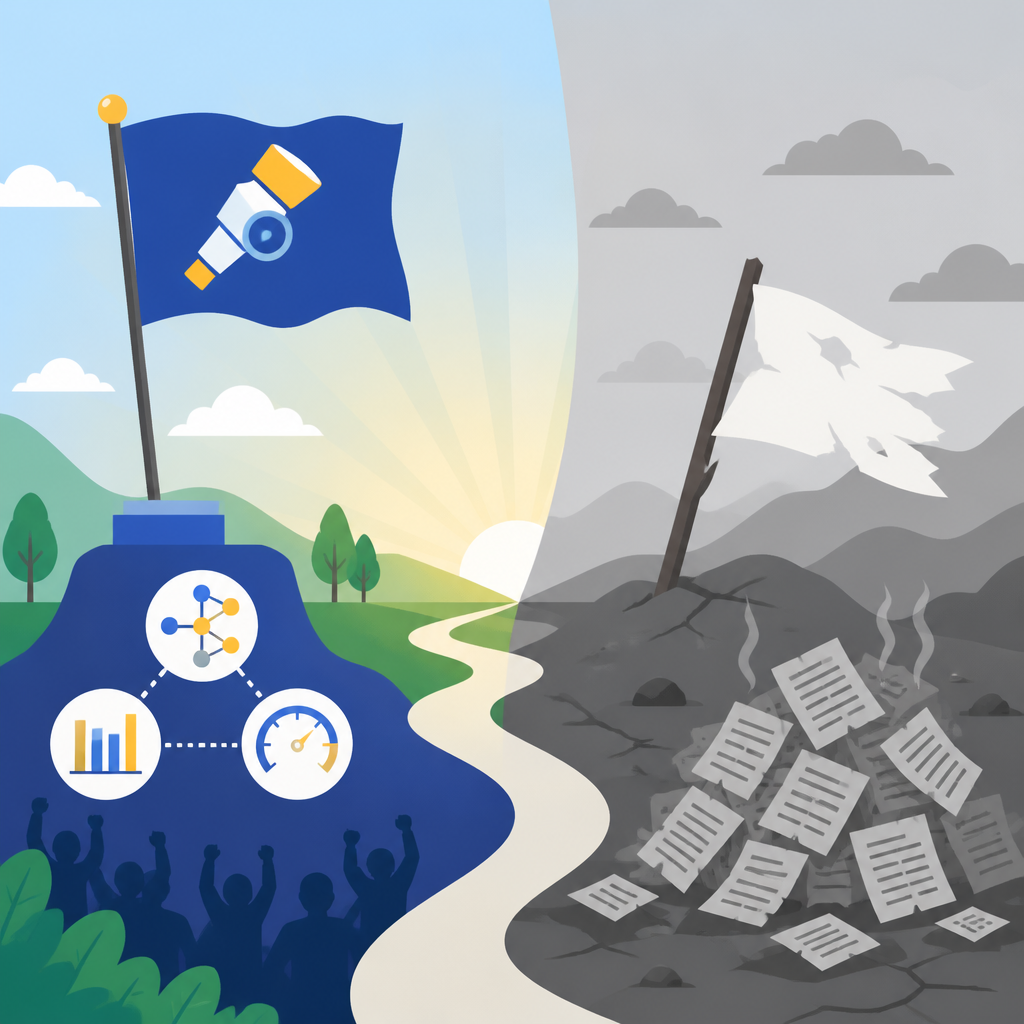
Why OpenTelemetry Won and Logs Lost the Observability War
OpenTelemetry is the new observability standard because traces beat logs in microservice debugging.
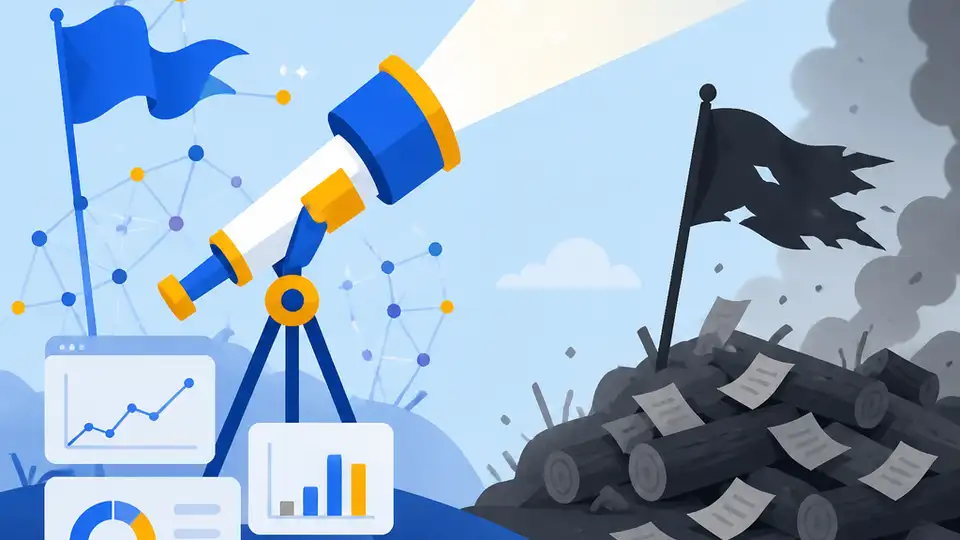
OpenTelemetry became the standard because traces expose failures faster than logs in microservices.
OpenTelemetry did not win observability by being fashionable; it won because microservices made logs too slow to trust and traces too hard to ignore. When a single request crosses 20 services, the old habit of grepping timestamps across unsynced machines turns into guesswork, and guesswork is not debugging. The teams that moved to trace-first workflows cut mean time to resolution from hours to minutes because they stopped asking, “What happened in this box?” and started asking, “Where did this request break?”
Distributed tracing solves the real debugging problem
Get the latest AI news in your inbox
Weekly picks of model releases, tools, and deep dives — no spam, unsubscribe anytime.
No spam. Unsubscribe at any time.
Logs are still useful, but they are no longer the source of truth in systems built from dozens of services. In a monolith, a stack trace often tells the whole story. In a distributed system, the failure is usually a chain of events: an upstream timeout, a retry storm, a slow database call, and a downstream queue that backs up under load. Tracing maps that chain directly, which is why it beats log archaeology every time.
The strongest evidence is operational, not theoretical. The article’s comparison is blunt: log-based debugging around 2020 often took more than four hours, while trace-based observability brings the same class of incident down to roughly 15 minutes. That is not a small improvement. It is the difference between an on-call team losing a night and an engineer fixing the root cause before the next customer ticket arrives.
OpenTelemetry won because it made tracing portable
Most observability tools fail the moment a team wants to switch vendors or run more than one backend. OpenTelemetry changed that by becoming the neutral instrumentation layer underneath the stack. Datadog, Honeycomb, Grafana Tempo, and AWS X-Ray can all consume the same signals, which means teams no longer have to rewrite instrumentation just to change where data lands.
That portability matters because instrumentation is expensive once it spreads across a codebase. OTel lets engineers add spans to HTTP handlers, SQL calls, and queues once, then route the data wherever the business needs it. The collector pattern is especially important: one pipeline can send traces to Tempo for low-cost retention and to Datadog for alerting, which gives teams leverage instead of lock-in.
Automation and sampling made tracing affordable
The old objection to tracing was cost. Manual spans everywhere sounded like a tax on every team, and at scale it was. OpenTelemetry removed most of that friction with auto-instrumentation, which captures common paths like HTTP requests, database calls through libraries such as SQLAlchemy and psycopg2, and messaging systems like Kafka without hand-wiring every span.
Cost control is the other half of the story, and tail-based sampling is the reason trace-first observability became practical. You do not need to keep every fast, successful request forever. You need to keep the bad ones and the slow ones, especially traces over one second and error paths that explain outage behavior. That selective retention turns tracing from a luxury into a disciplined system, because it preserves the evidence that actually changes decisions.
The counter-argument
Log-first defenders are not wrong about one thing: traces do not replace logs completely. Logs remain better for payload inspection, application-specific context, and forensic detail when you already know where to look. A trace can show you that payment processing failed in a downstream service, but the log may still be the only place that shows the exact validation message or third-party response body.
There is also a legitimate maturity gap. Not every team has clean propagation, consistent span naming, or a collector pipeline they trust. If instrumentation is sloppy, traces become a pretty UI over incomplete data. In that state, logs can feel more dependable because they are easier to emit and easier to search.
But that counter-argument does not rescue log-centric observability. It only proves that logs remain a supporting signal. In a distributed system, the hard part is not reading detail after you know the fault domain; it is finding the fault domain in the first place. Traces do that faster, and OpenTelemetry standardizes the path so teams can do it without betting the company on a single vendor or a custom instrumentation scheme.
What to do with this
If you are an engineer, instrument the critical path first: ingress, database calls, queue hops, and payment or auth boundaries. If you are a PM or founder, stop measuring observability by log volume and start measuring it by resolution time, error retention, and the percentage of services emitting usable traces. The practical move is simple: adopt OpenTelemetry as the default, keep logs for detail, and make traces the first place your team looks when latency or failure spreads across services.
// Related Articles
- [TOOLS]
500 AI agent projects show where agents work now
- [TOOLS]
Chocolatey’s Go package turns installs into policy
- [TOOLS]
Go support policy turns releases into a checklist
- [TOOLS]
RustDesk self-hosting setup for secure remote access
- [TOOLS]
Aider turns open-source coding into repo edits
- [TOOLS]
WWDC 2026 rumors turn Siri into a real assistant