Why Vietnam’s weather pages should stop pretending forecasts are neut…
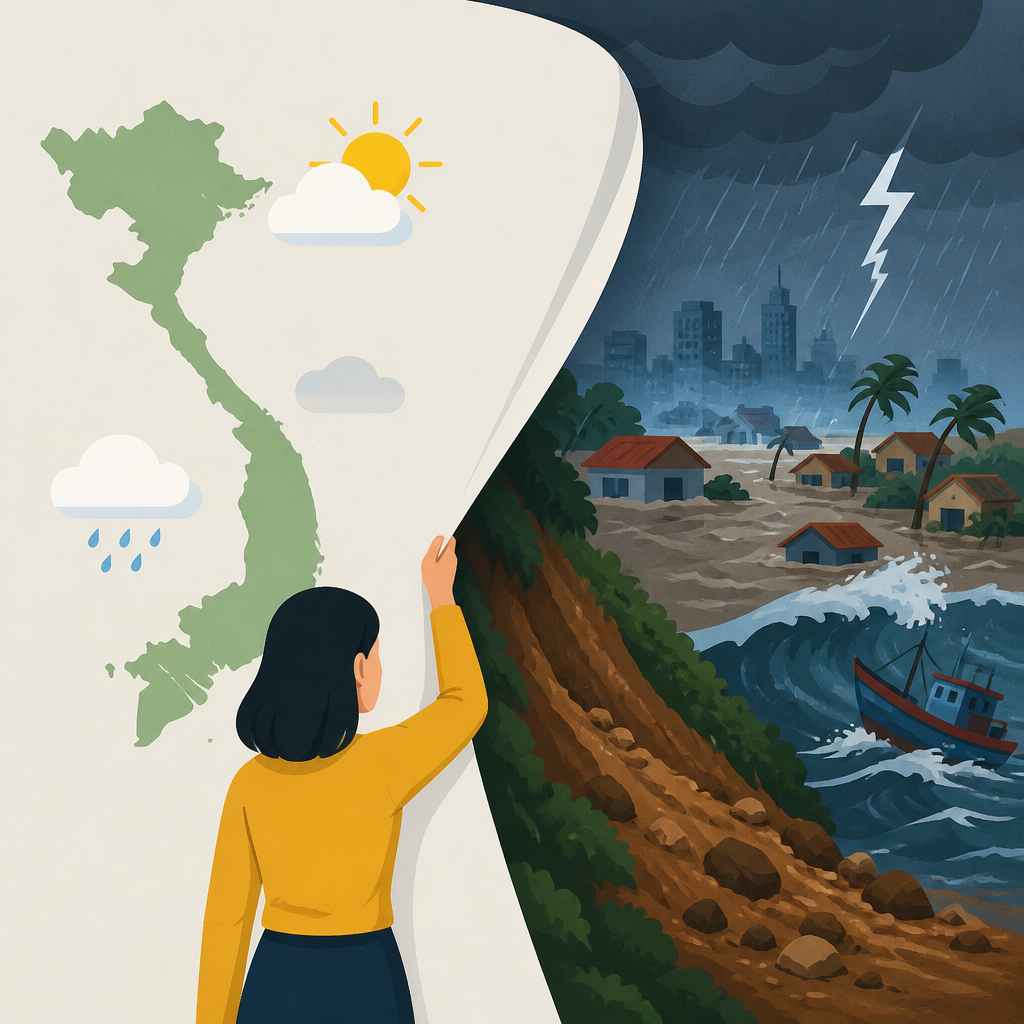
Weather forecasts should lead with risk, not just temperature tables.

Weather forecasts should lead with risk, not just temperature tables.
Weather pages in Vietnam should stop packaging forecasts as neutral daily updates and start treating them as public-safety alerts. The 24h weather page does both, but its structure still buries the most important fact: on 20/5, the North, Thanh Hóa, and Nghệ An were at the peak of a heavy-rain event with 50-120mm common rainfall and some places above 250mm, while the rest of the page is dominated by city-by-city temperatures, icons, and air-quality numbers.
Risk belongs above convenience
Get the latest AI news in your inbox
Weekly picks of model releases, tools, and deep dives — no spam, unsubscribe anytime.
No spam. Unsubscribe at any time.
The first job of a weather page is not to be complete, it is to be useful under pressure. If a reader in Hà Nội or a mountain district is deciding whether to travel, the sentence about lũ quét, sạt lở, and ngập lụt matters more than the fact that Hà Nội’s AQI was 80 or TP.HCM’s was 55. Those numbers are not irrelevant, but they are secondary to a forecast that explicitly warns of flash floods and landslides.
This is not a theoretical concern. The page itself says the 20/5-21/5 window was the peak of the rain band, with dangerous accumulation in the North and North Central region. That is the kind of information that should shape the page’s hierarchy, because the user’s decision is often binary: leave now, stay home, move equipment, or postpone work. A forecast that opens with a grid of 27-35°C readings before the hazard note fails that test.
Tables help planners, not the public at large
The city-by-city table is useful for a logistics team, a newsroom desk, or a PM building a weather widget. It is not the best primary format for ordinary readers. When the page lists dozens of locations with near-identical labels such as “có mưa rào và dông” or “ít mây, trời nắng nóng,” the signal gets flattened. The human brain does not scan 60 rows to find the one line that says Quảng Bình is 29-38°C with extreme heat while nearby provinces are still in storm mode.
There is a better model already visible in the same source: the article pairs broad regional warnings with specific impacts. That is the right pattern. For example, “miền Bắc mưa rất to” is a stronger headline than “Hà Nội 23:20 - 22/05/2026,” because it tells the reader what kind of day they are about to have. The page should make that distinction sharper, not weaker, by moving from broad danger to local detail, not the other way around.
Air quality is important, but it is not the lead
Including air-quality indices is smart. A person with asthma, a runner, or a parent planning outdoor time needs that data. But AQI belongs in a supporting role unless the page is explicitly about pollution. On this page, AQI values for Hà Nội, TP.HCM, Hải Phòng, Nha Trang, Đà Nẵng, and Đà Lạt are presented alongside weather, which creates a false sense that all metrics deserve equal attention.
That design choice matters because it nudges readers toward the wrong mental model: weather as a dashboard of equally weighted widgets. In reality, the page is dealing with a compound risk event. Heavy rain, thunderstorms, possible hail, and flooding are immediate hazards. AQI 80 versus 55 is useful context, but it should never compete with a warning that says “nguy cơ cao xảy ra ngập úng, lũ quét và sạt lở đất.”
The counter-argument
Defenders of the current format have a fair point: weather sites serve many audiences at once. A commuter wants the hour-by-hour feel, a farmer wants the multi-day trend, a traveler wants the next three days, and a parent wants to know whether school pickup will be wet. A dense table can satisfy all of them in one place, and a simple alarm-first layout can feel alarmist or repetitive when the weather is merely variable.
That argument is strongest on calm days. It is weaker during a hazard event. When the forecast includes specific threats such as flash floods, landslides, and severe thunderstorms, the page is no longer just a convenience tool. It is a risk communication channel. In that mode, the right answer is not to remove the table, but to demote it beneath the warning and add clear priority labels such as “danger today,” “watch tomorrow,” and “low concern.”
The tradeoff is real, and I accept it: planners still need the grid. But the grid should not be the front door. If the first thing a reader sees is a list of temperatures and city names, the site has already failed the most important weather task, which is to tell people what can hurt them today.
What to do with this
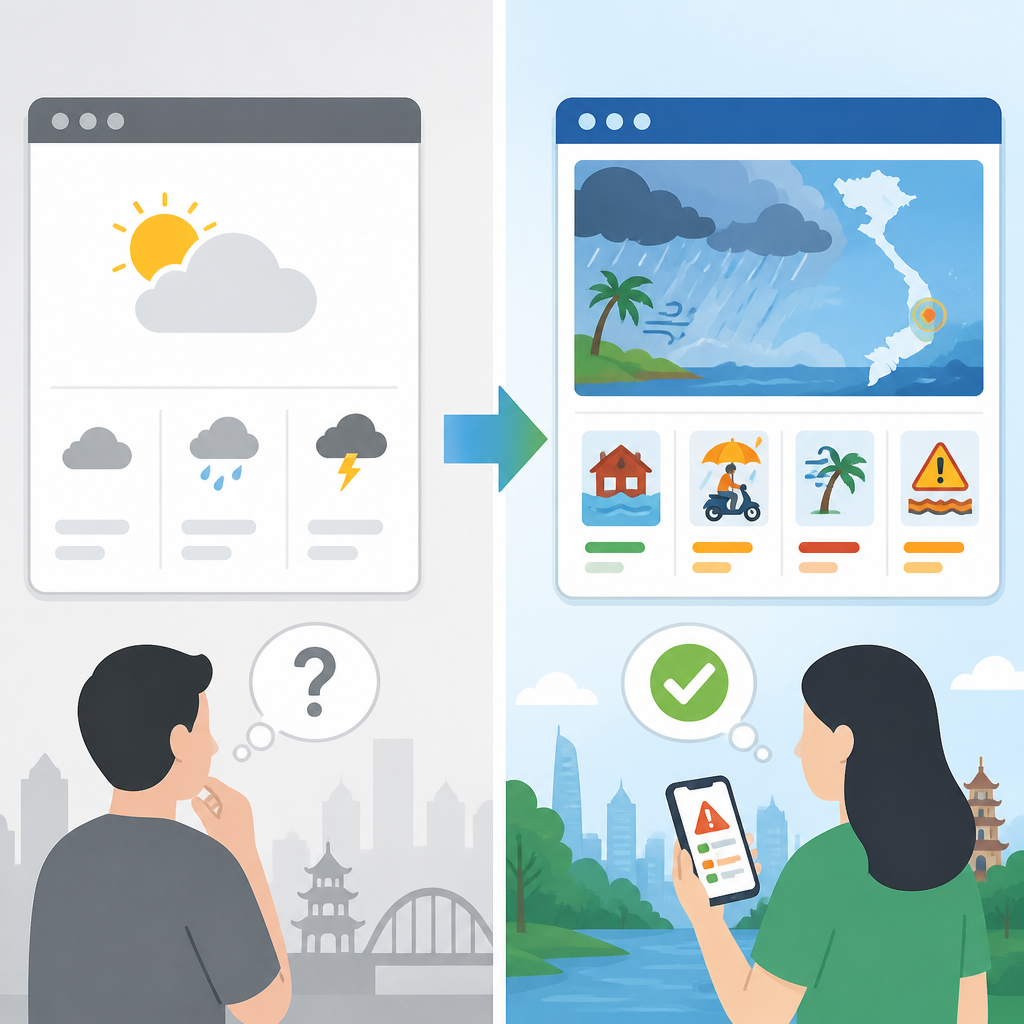
If you are an engineer or PM building a weather product, redesign the page around severity first, detail second. Put hazard alerts, rainfall totals, and affected regions at the top. Put AQI, temperature ranges, and city grids below that. Use color and labels to separate “informational” from “actionable.” If you are a founder, treat weather as a trust product, not a content feed: the best forecast is the one that helps someone change behavior before the rain hits.
// Related Articles
- [IND]
Gemini lands inside Apple’s developer stack
- [IND]
Five AI coding IDEs that fit real workflows
- [IND]
Devin Desktop turns Windsurf into an agent hub
- [IND]
Korea’s Nvidia talks point to an AI factory push
- [IND]
OpenAI should not rush its IPO just to win the AI race
- [IND]
OpenAI updates its Europe privacy policy